App Only
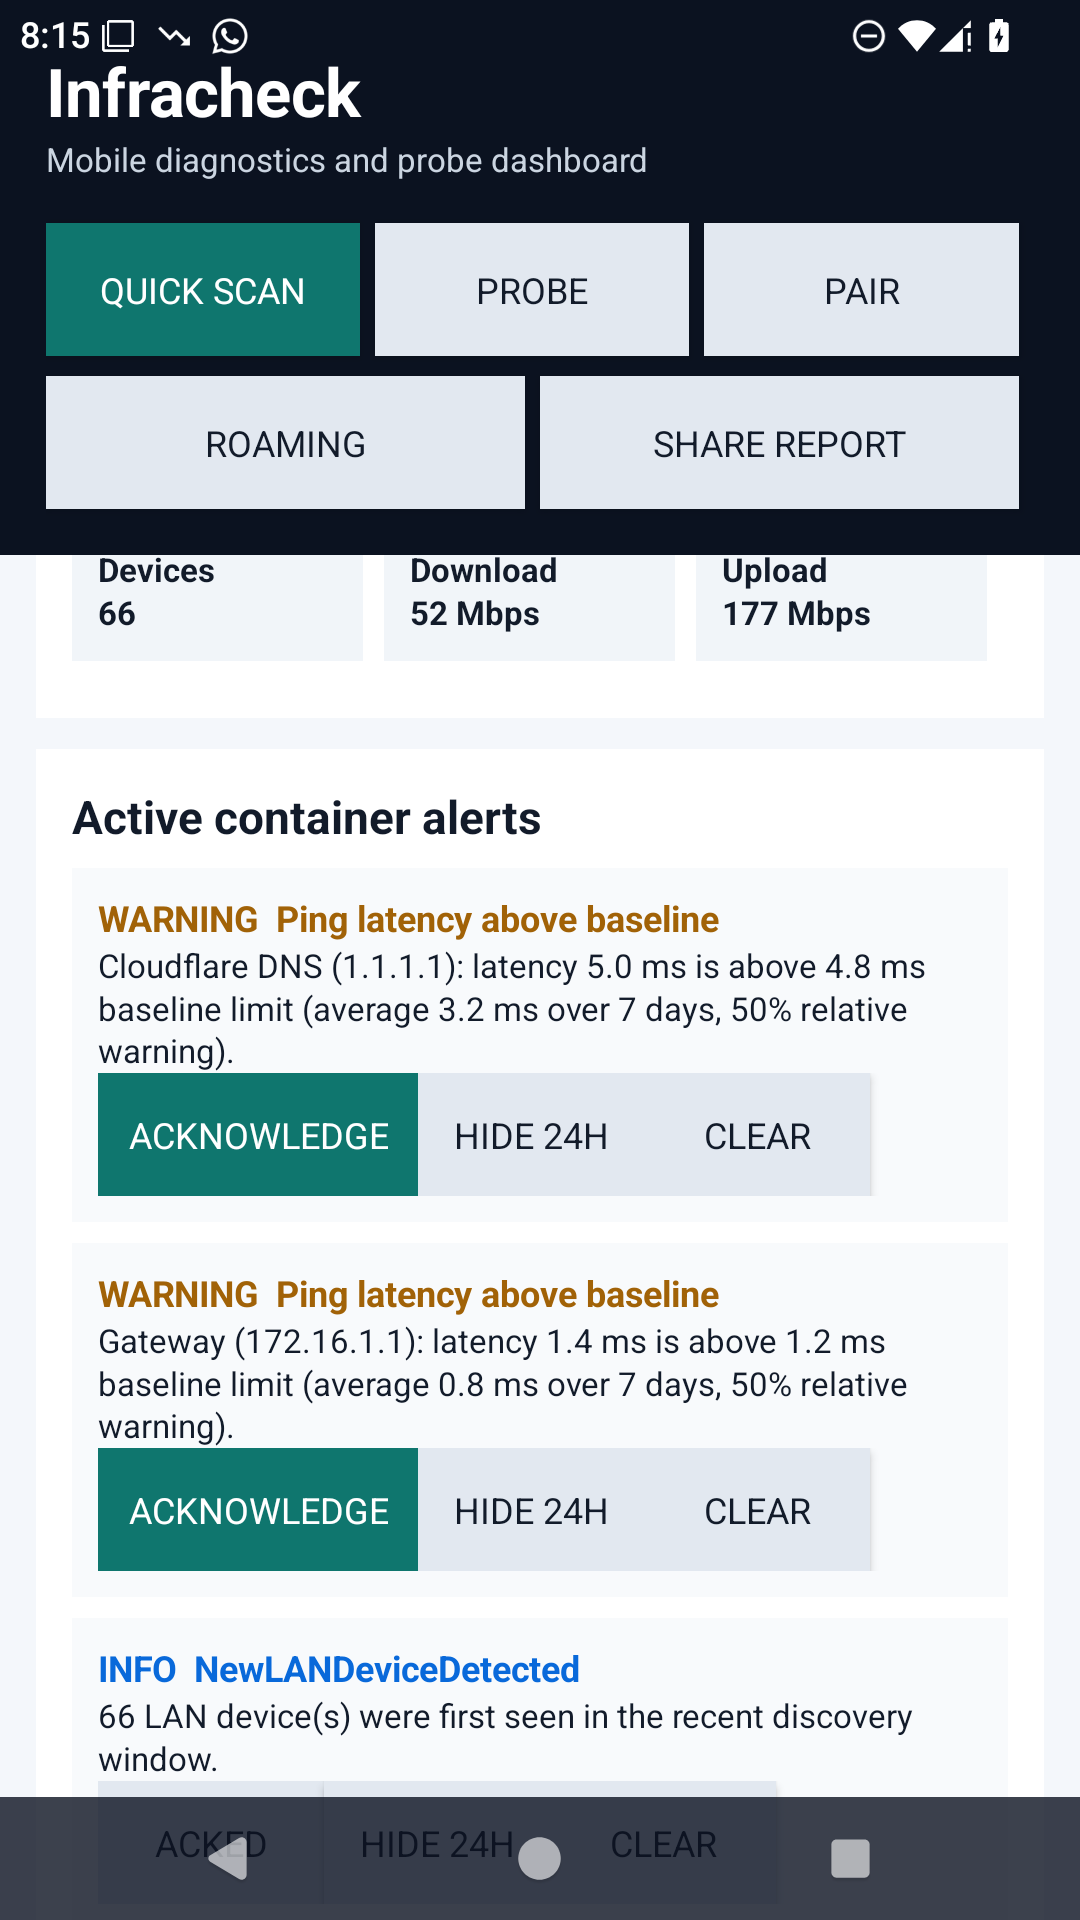
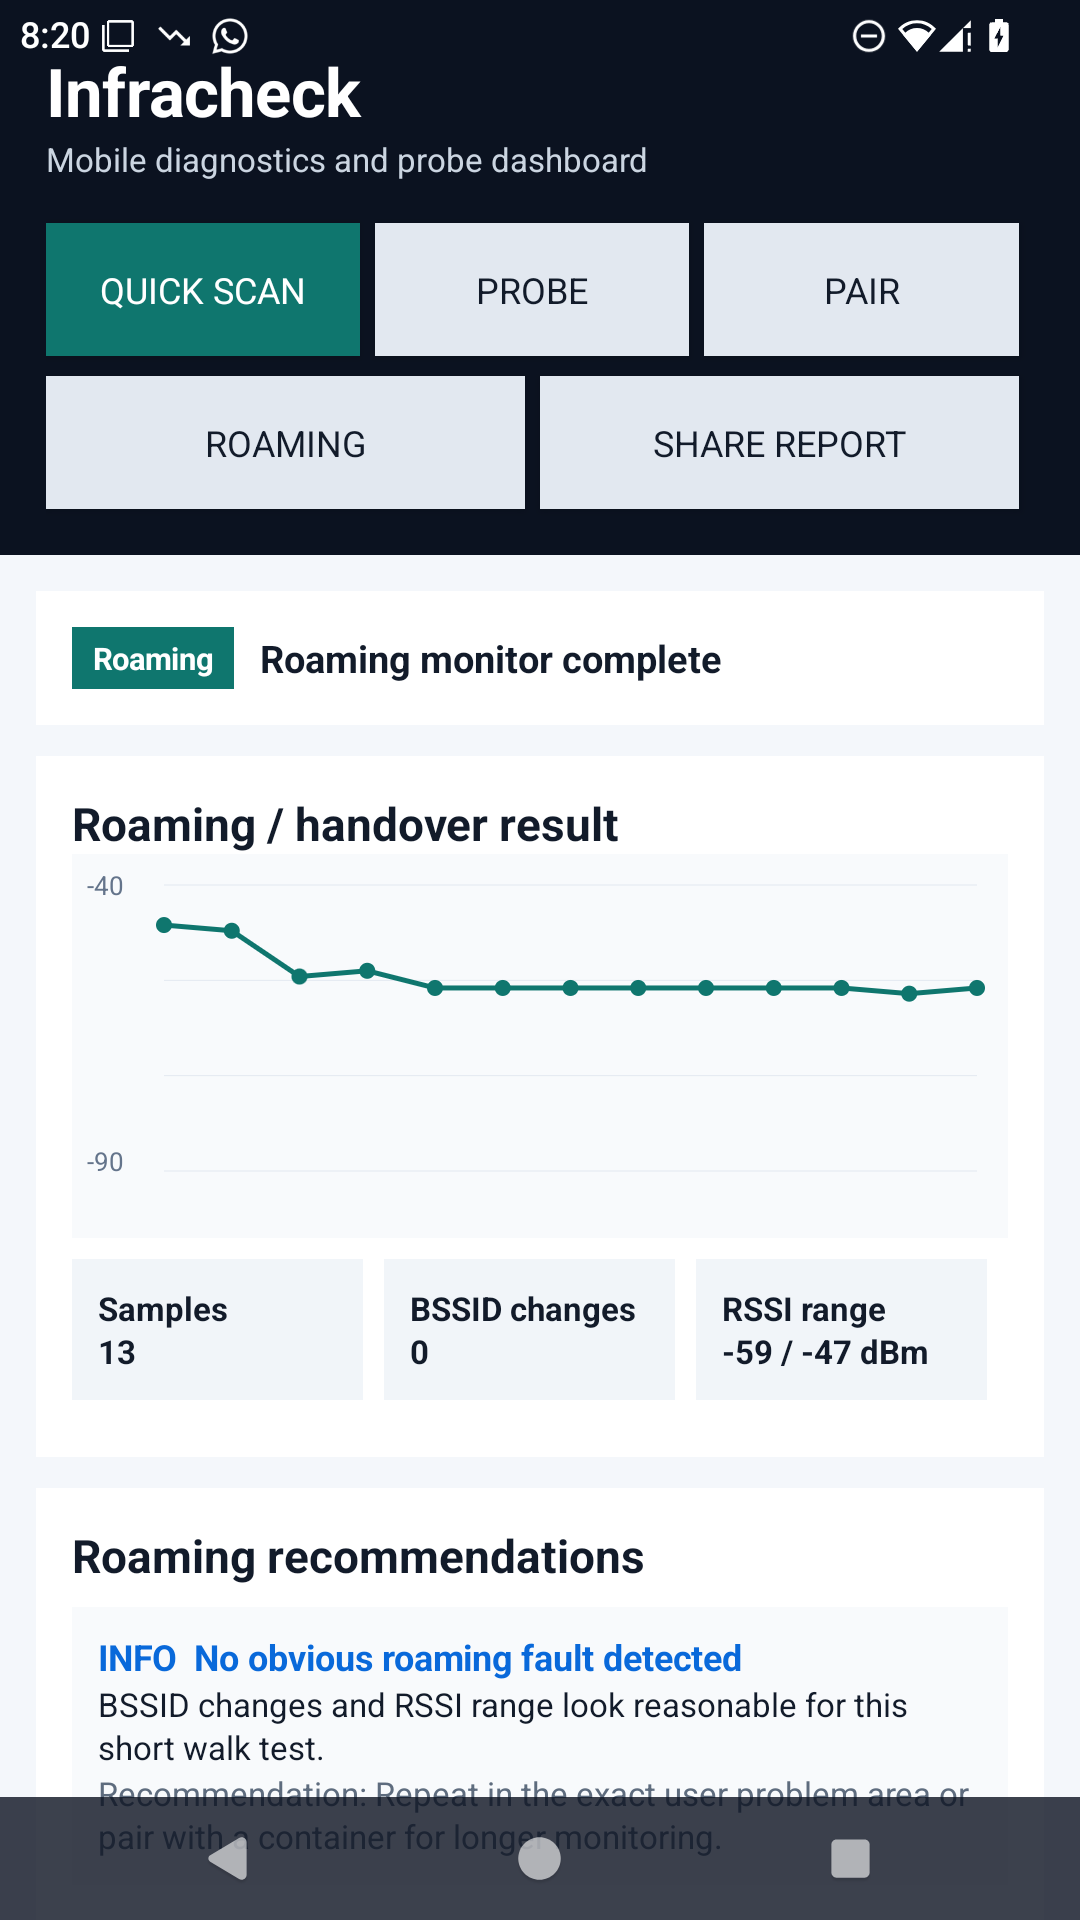
Phone-side Wi-Fi, DNS, HTTP, captive portal, channel congestion, and roaming evidence.
Product documentation
Full product documentation for App Only diagnostics, App + Appliance monitoring, local deployment, configuration, reports, security, API checks, and troubleshooting.

Infracheck is a local-first infrastructure telemetry stack for small IT support teams and MSPs. It combines a native Android field app with a Docker-based local appliance so technicians can compare what the phone sees with what the customer network sees continuously.
App Only is for field diagnostics without deployed hardware. App + Appliance is for continuous site monitoring. Premium License is the planned self-hosted central layer for multi-site and MSP operations.
Phone-side Wi-Fi, DNS, HTTP, captive portal, channel congestion, and roaming evidence.
Continuous local telemetry, LAN inventory, alerts, reports, and configuration from the field app.
Self-hosted central portal, multiple appliances, white label, alert routing, roles, API, and MSP workflows.
The stack is intentionally simple: the phone captures client experience, the appliance captures site-wide telemetry, and Premium centralization remains self-hosted.
Use App Only when the technician is on site without a deployed appliance. This mode sees the network from the phone perspective.
Use this mode when a Linux Docker appliance is deployed in the customer network. It is the recommended support workflow because history remains available after the technician leaves.
_infracheck._tcp, or pair manually by URL and admin token.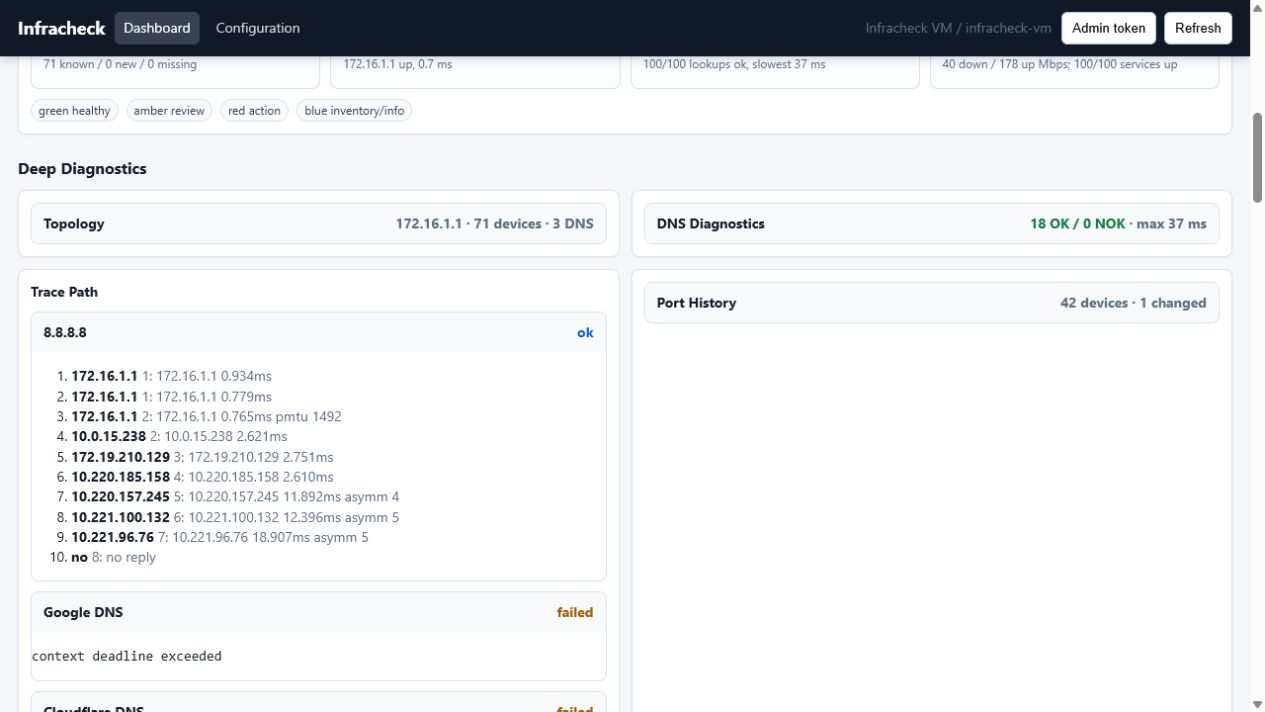
Infracheck v1 targets Linux Docker hosts on the target LAN.
unzip infracheck-appliance-kit.zip
cd infracheck-appliance-kit
sh scripts/install-linux.sh.env with generated admin/read/Grafana tokens if missing.config/config.yaml from the example if missing.data/ folder.docker compose up -d --build.http://<host-ip>:8080/uihttp://<host-ip>:3000http://<host-ip>:9090http://<host-ip>:9093The default appliance config is mounted at /etc/infracheck/config.yaml. In local deployments, edit container/config/config.yaml.
INFRACHECK_CONFIGINFRACHECK_ADMIN_TOKENINFRACHECK_READ_TOKENINFRACHECK_PROTECT_METRICSINFRACHECK_ALLOW_PUBLIC_READSINFRACHECK_STORAGE_PATHINFRACHECK_SITE_IDINFRACHECK_SITE_NAMEINFRACHECK_SITE_LOCATIONINFRACHECK_PORT
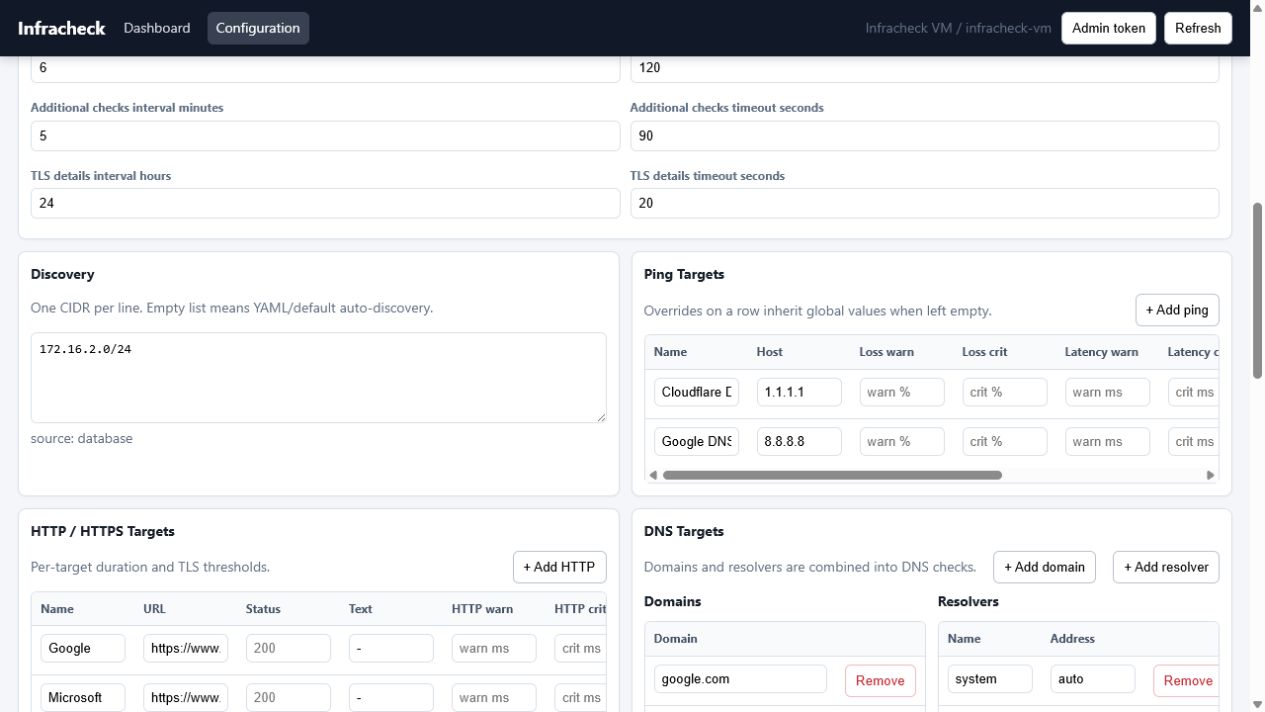
When discovery CIDRs are empty, the agent auto-detects directly connected IPv4 networks and caps broad masks to /24. For routed networks or multiple VLANs, configure every range explicitly.
targets:
  discovery:
    cidrs:
      - "192.168.10.0/24"
      - "192.168.20.0/24"
      - "10.20.0.0/23"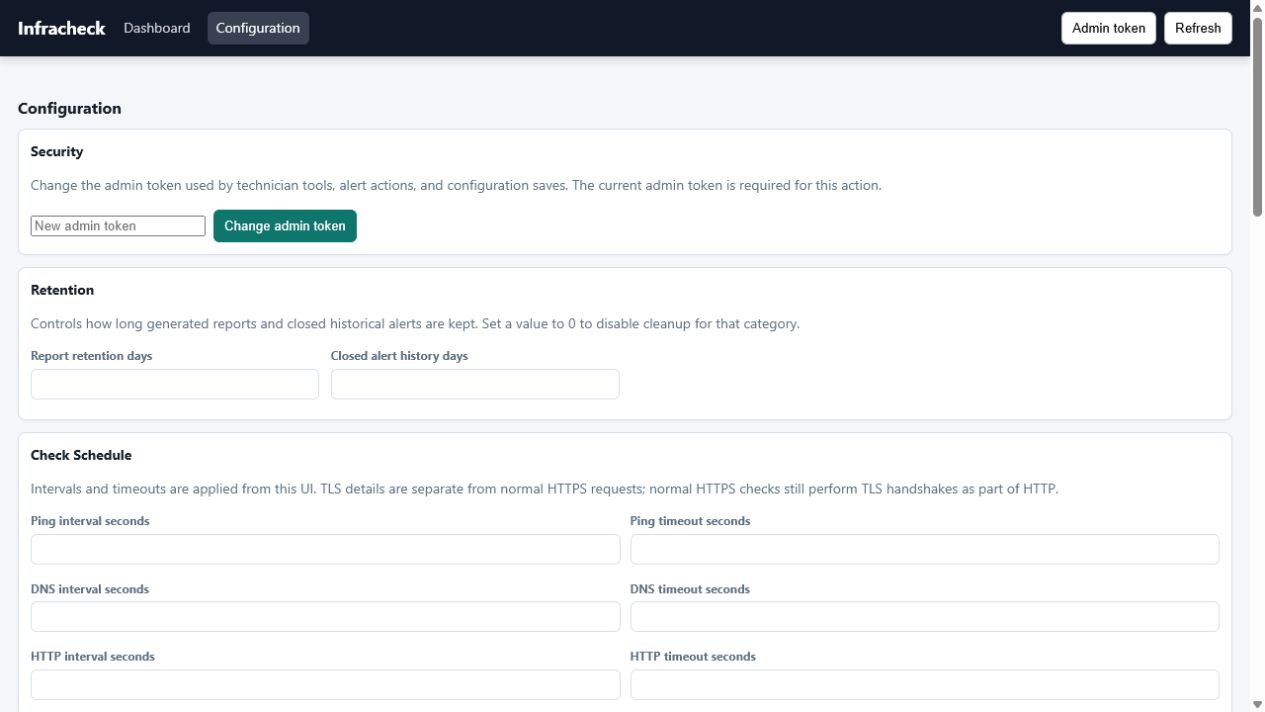
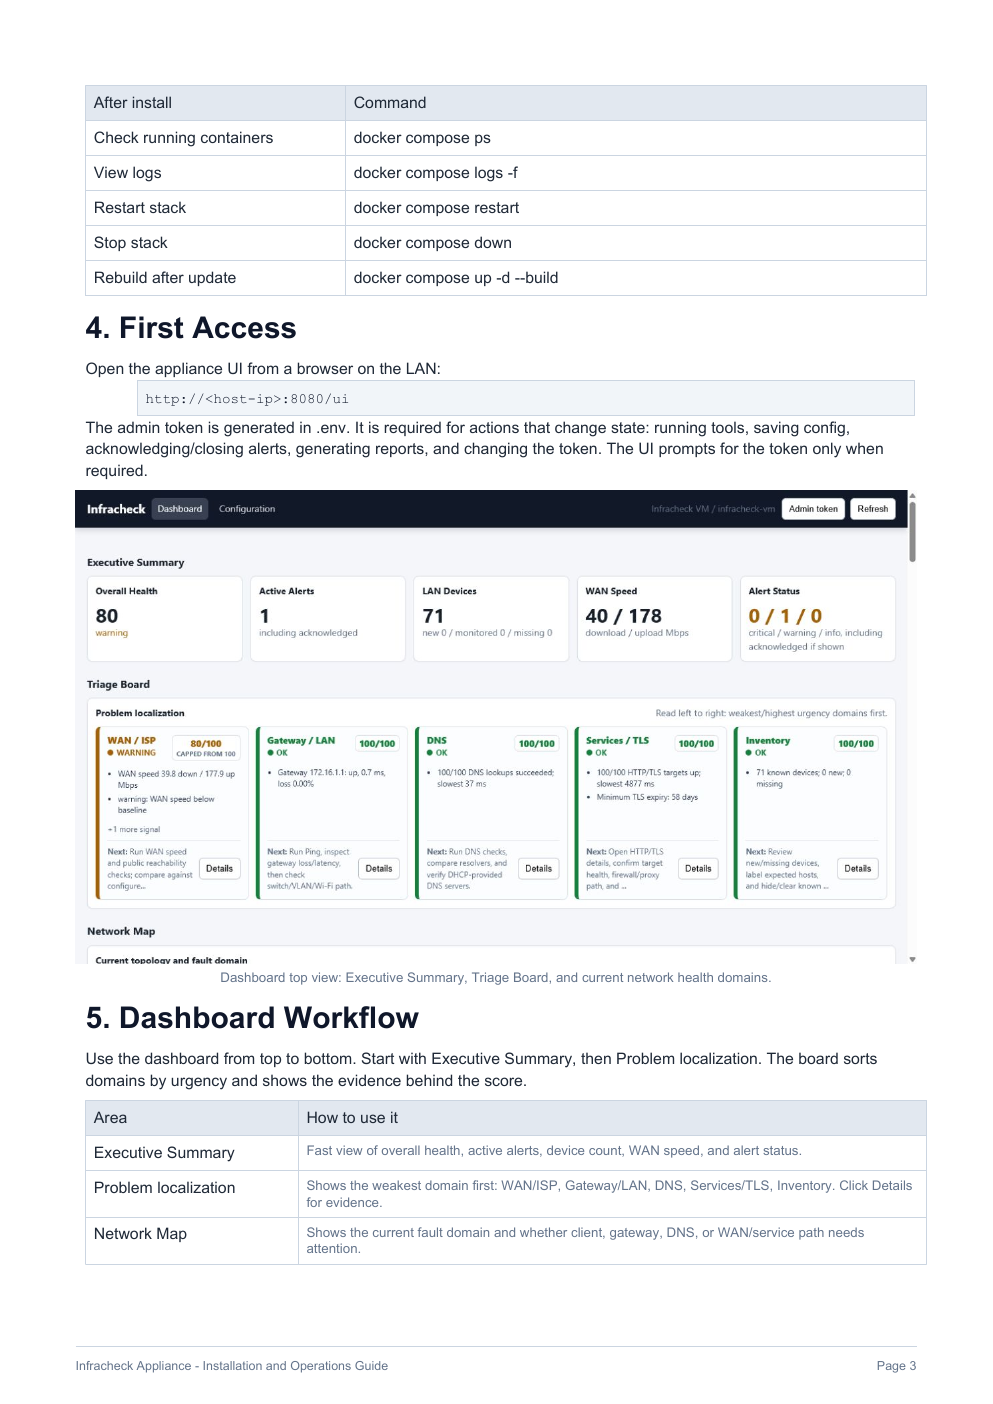
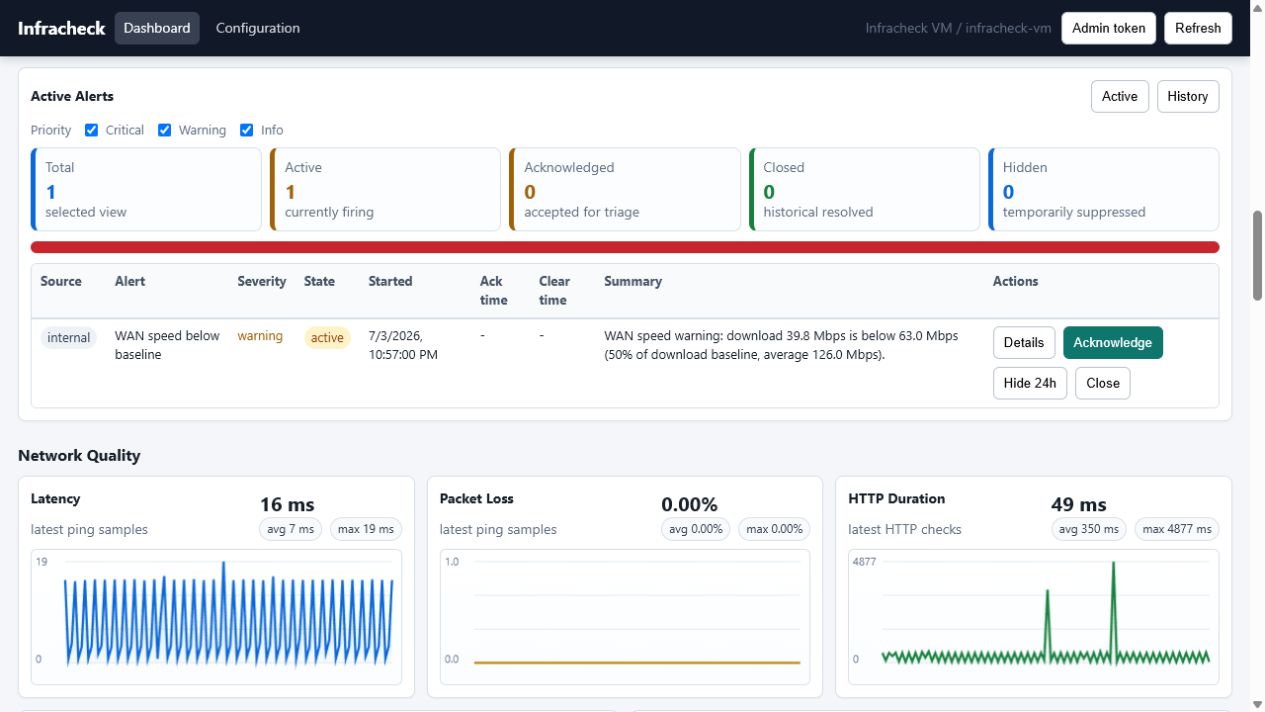
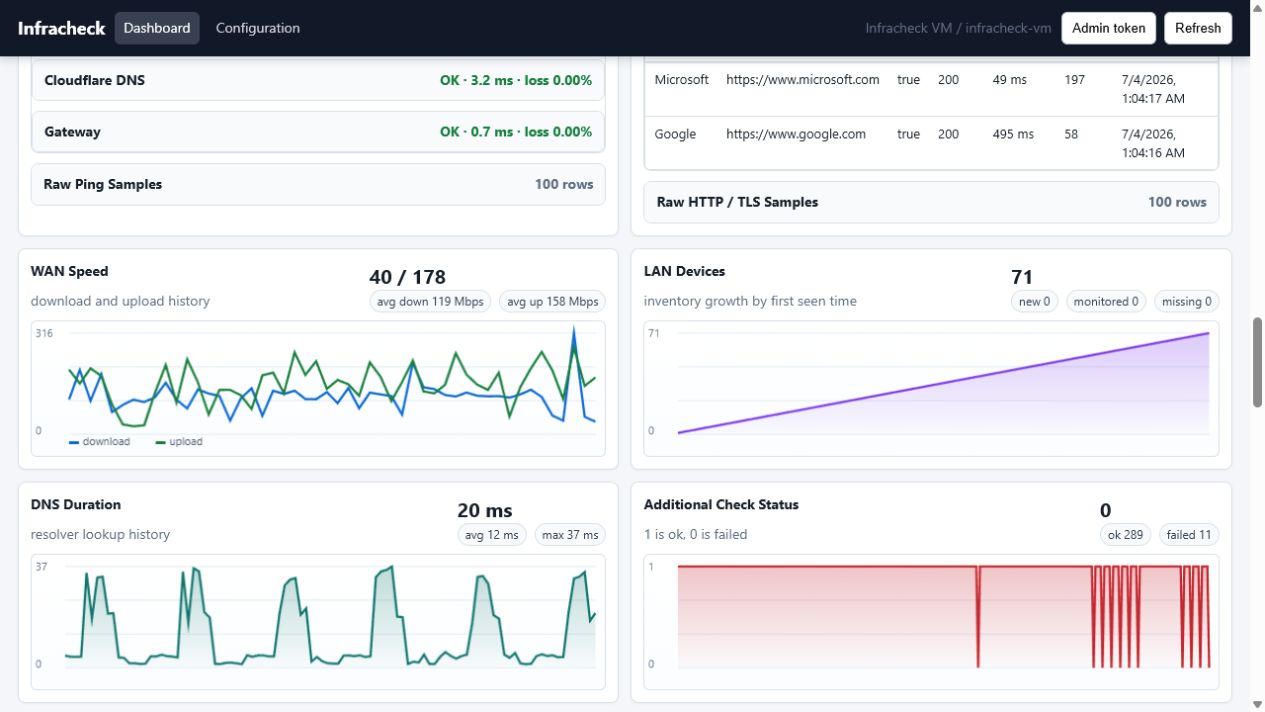
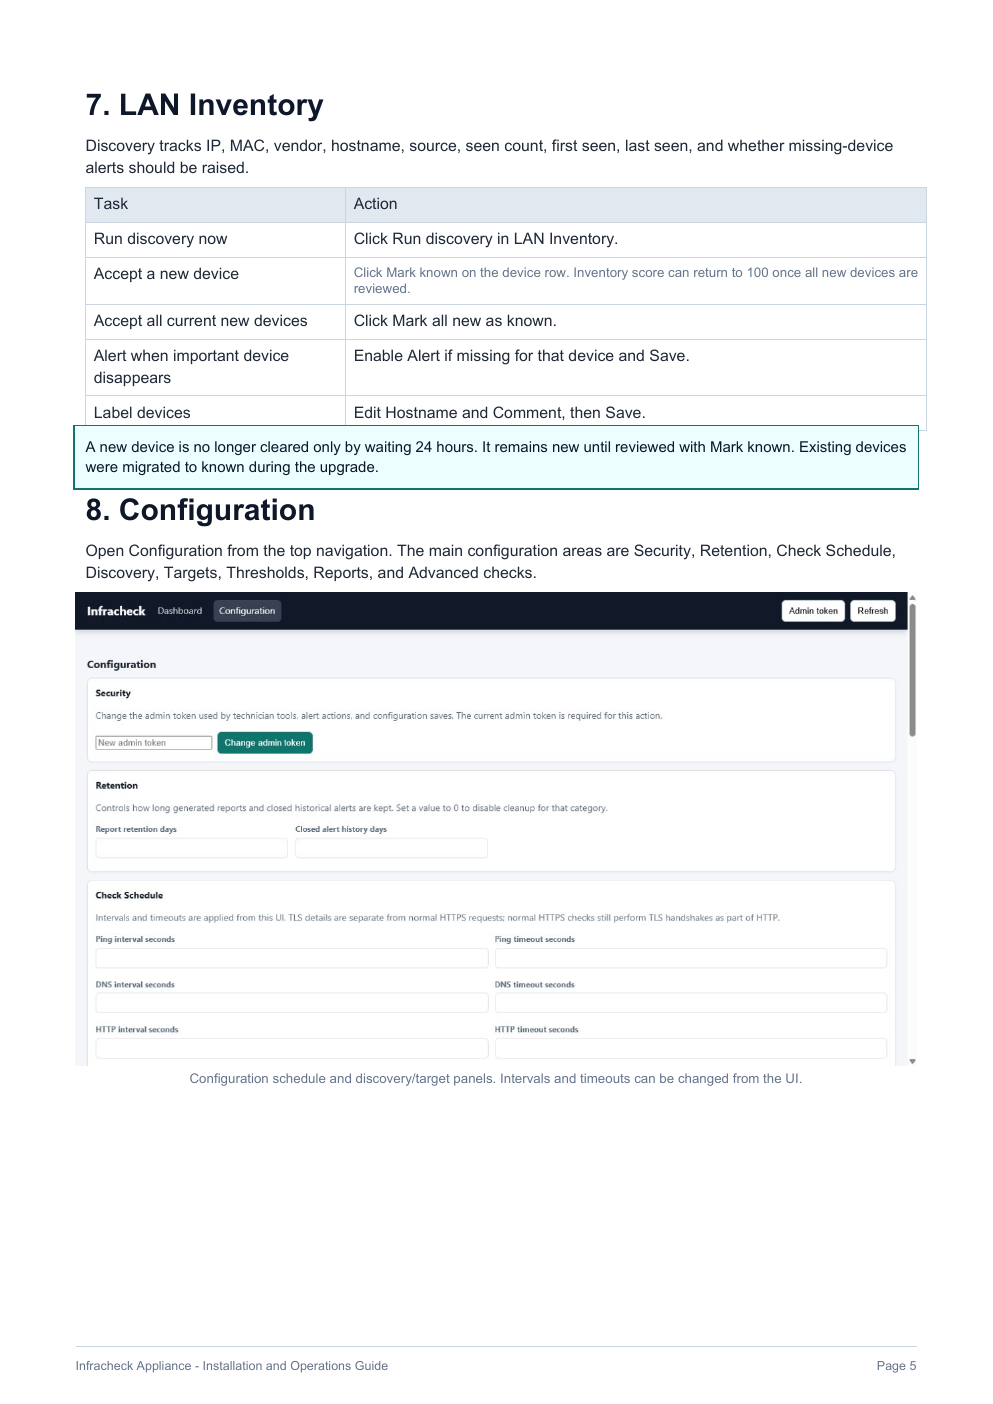
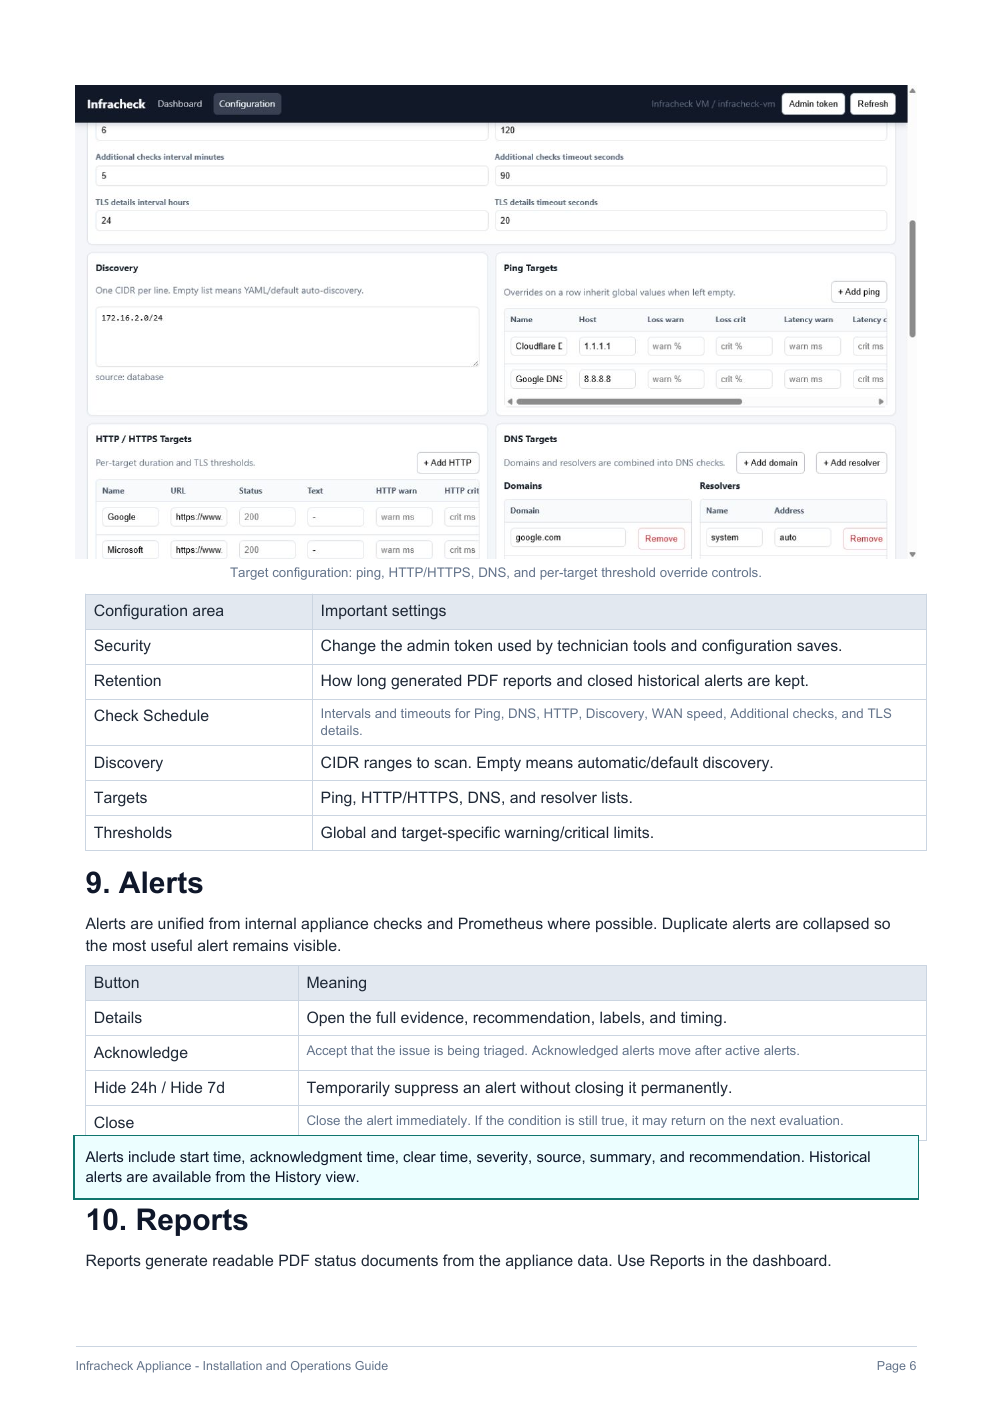
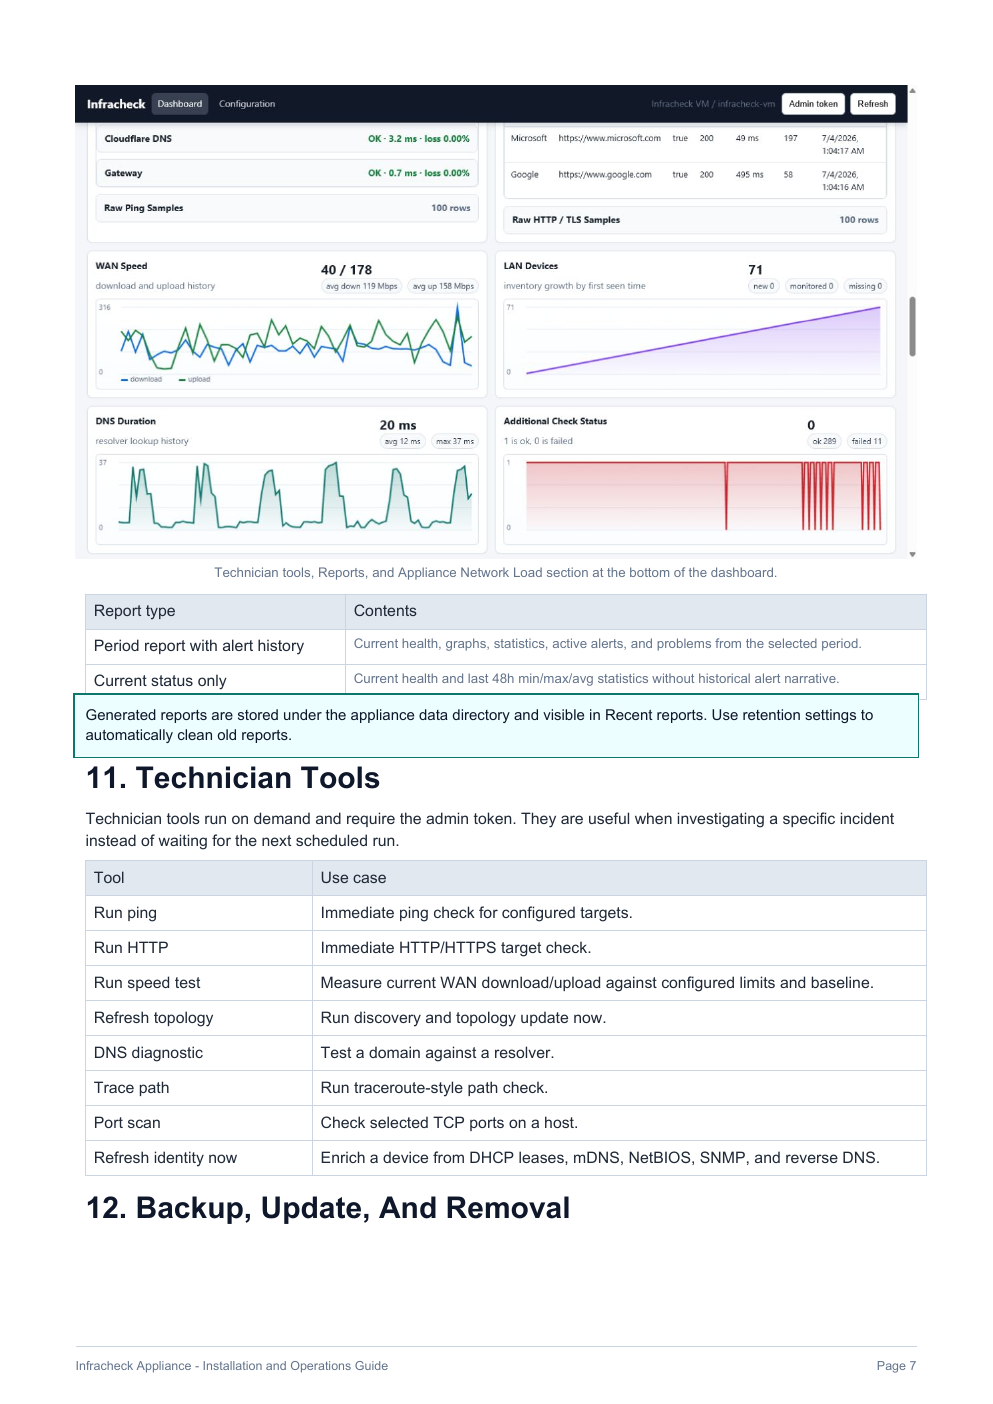
The appliance UI is designed as the technician command center for a customer site.
Reports convert support work into customer-visible evidence. Use them after installs, after incident triage, before/after remediation, or for recurring account reviews.
Infracheck is local-first. The free appliance runs inside the customer network, and Premium centralization is planned as self-hosted.
security.protect_metrics: true or INFRACHECK_PROTECT_METRICS=true to protect /metrics.security.allow_public_reads: false or INFRACHECK_ALLOW_PUBLIC_READS=false to protect read-only API endpoints.Authorization: Bearer <token> and X-Infracheck-Token: <token>.--privileged by default..env, generated tokens, Grafana credentials, and data/ private.Use these commands during installation validation, troubleshooting, or automation.
curl http://localhost:8080/healthz
curl http://localhost:8080/readyz
curl http://localhost:8080/api/v1/info
curl http://localhost:8080/api/v1/health
curl http://localhost:8080/api/v1/verdicts/latest
curl http://localhost:8080/api/v1/recommendations
curl http://localhost:8080/api/v1/tests/ping/latest
curl http://localhost:8080/api/v1/tests/dns/latest
curl http://localhost:8080/api/v1/tests/http/latest
curl http://localhost:8080/api/v1/tests/speed/latest
curl http://localhost:8080/api/v1/devices
curl http://localhost:8080/api/v1/reportscurl -X POST http://localhost:8080/api/v1/tests/ping/run \
-H "Authorization: Bearer $INFRACHECK_ADMIN_TOKEN"
curl -X POST http://localhost:8080/api/v1/discovery/run \
-H "Authorization: Bearer $INFRACHECK_ADMIN_TOKEN"
curl -X POST http://localhost:8080/api/v1/reports/generate \
-H "Authorization: Bearer $INFRACHECK_ADMIN_TOKEN" \
-H "Content-Type: application/json" \
-d '{"type":"daily","hours":24}'cd container
docker compose logs -fcurl http://localhost:8080/healthz
curl http://localhost:8080/readyz
curl http://localhost:8080/metricscurl -X POST http://localhost:8080/api/v1/iperf/server/start \
-H "Authorization: Bearer $INFRACHECK_ADMIN_TOKEN"
iperf3 -c <agent-ip>
curl -X POST http://localhost:8080/api/v1/iperf/server/stop \
-H "Authorization: Bearer $INFRACHECK_ADMIN_TOKEN"curl -X POST http://localhost:8080/api/v1/discovery/run \
-H "Authorization: Bearer $INFRACHECK_ADMIN_TOKEN"
curl http://localhost:8080/api/v1/devicesIf gateway auto-detection fails, set targets.gateway.address explicitly in the config.
Yes. The field app is positioned as free.
Yes. The local appliance/container is positioned as free.
No. The current positioning is a paid Premium License with a self-hosted central portal.
The Start Free page is ready for the Android app link and the appliance container link when they are available.
http://<appliance-ip>:8080/ui.